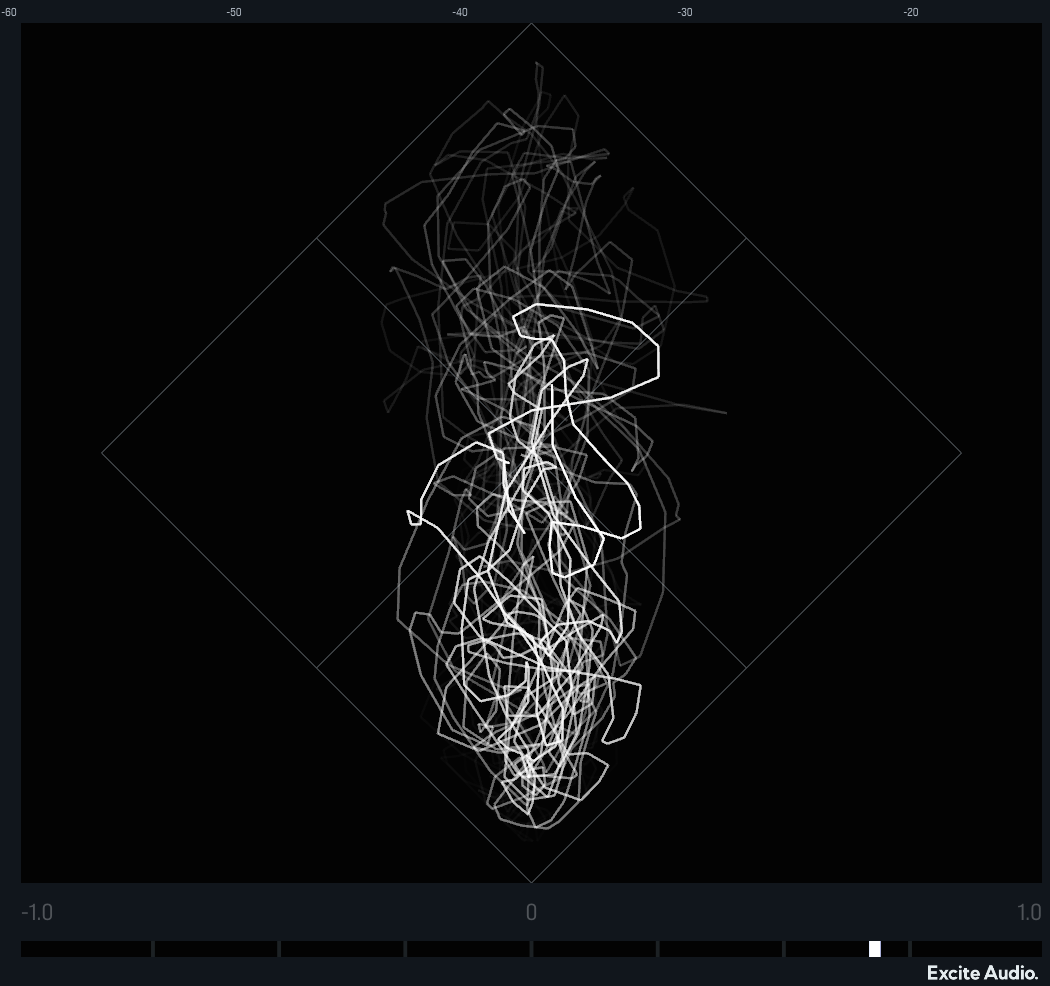
Producers this one’s for you. Excite Audio have released a plug-in in collaboration with Noisia and it’s called ‘VISION 4X’. ‘VISION 4X’ is a VST/AU/AAX analyser which promises to give you a deeper understanding of your sound design than ever before. The plug-in consists of four visual analytical tools- a spectrogram, bar graph, wave form and phase correlation meter. The analysers run simultaneously in real time, each in their own resizable window, giving you the freedom to scale the interface to match your workflow. The presets included in ‘VISION 4X’ were designed by Noisia- and if the last 20 years have shown us anything- were pretty sure what Noisia don’t know about production isn’t worth knowing.
‘VISION X4’ is designed with inclusivity in mind, the plugin can be synced with any DAW and you’ll be able tailor the analytical timeframe to your individual project, meaning you’ll be able to hone in on exactly what you want to see. The analysers can run continuously or if you prefer you can loop a section of time. Need to compare kicks? By setting the plugin to retrigger everytime a MIDI signal is received, you’ll be able to look at particular sounds.
Spectrogram
The spectrogram shows advanced information about the low end frequencies in your mix, this tool allows you to freeze the frame and zoom into the frequency spectrum meaning you can dig deep into minute details that would otherwise have been missed. Spectrogram has three visualisation options- ‘Transient Mode’, ‘Harmonic Mode’ and ‘All-round’, giving you more control over the exact date you want to analyse.
The Spectrogram’s display is completely customisable with ten different Colour Maps to choose from- each created to display the optimum density when analysing your sound and brightness can be configured to either high or low frequencies using ‘Map Bias’. The visualiser also boasts Range Hz and Rage Db sliders giving you greater control over the frequency and volume range of the display.
Bar Graph
This visualiser highlights the gain levels of the sustained frequencies throughout your mix, you can set the tool to analyse the overview of your work in its entirety or opt for more precise analysis by shortening the length of the graph. Make more informed decisions about your mix by using ‘Peak Hold’ sustain control and the built in reference curves which were generated through thorough analysis of hundreds of tracks.
Waveform
The Waveform visualiser gives you in depth information about your sound source. With this tool’s magnification and intuitive colour-coding, you can inspect crucial pitch, volume and timing information. The Waveform visualiser is paired with VU and RMS metering tools meaning you can access the loudness level easily, and keep track of your headroom with an ‘Overshoot Highlight’ feature which alerts you if you go over 0dB.
Phase Correlation Meter
This tool allows you to explore the stereo dimensions of your sound, giving you intricate insights into the left and right balance. The Phase Correlation Meter’s centre line clearly shows any alignment issues, preventing any audio loss when converting to mono.
Check out the plug-in in more detail here.
